Assessment on the impact of mining and industrial activities in groundwater quality in Chandrapur, Maharashtra through remote sensing and GIS applications
Keywords
GIS · Land use and land cover · Remote sensing · Residual sodium carbonate · Sodium adsorption ratio (SAR) · Water quality
HIGHLIGHTS
- Chandrapur’s groundwater exhibited stable chloride levels near mining and industrial areas between 2014 and 2018, consistently within Bureau of Indian Standards (BIS) safe limits.
- Fluoride contamination witnessed an increase near industrial sites during the same period, although it remained within permissible limits.
- pH values displayed fluctuations but stayed within acceptable ranges. There was a slight decline from 2014 to 2018, suggesting potential changes in water quality.
- RSC levels near industrial areas rose in 2018, signalling a risk of soil degradation and a potential reduction in agricultural water availability.
- SAR values experienced an increase in 2018 near industrial areas, posing a potential threat to soil fertility and crop growth. However, they remained below BIS standards for irrigation water quality.
1. INTRODUCTION
Groundwater, an essential component of the Earth’s hydrological cycle, plays a pivotal role in sustaining biodiversity, maintaining ecosystems and supporting human life (Abijith et al., 2020). Over the last few decades, groundwater quality has become a growing concern due to the immense anthropogenic pressures of industrial development, agricultural activities and mining operations (Bagchi et al., 2002). The burgeoning groundwater contamination problem threatens human health and livelihood and undermines the ecological equilibrium (Becker, 2006).
In India, groundwater is a major source of water for daily requirements of most of the population (Boutroy et al., 2014; Duggal et al., 2017). However, several factors, such as industrial growth, increased agricultural output, poor management and uncontrolled groundwater exploitation, have led to a shortage of potable water (Chilton, 1996). The groundwater potential of an area depends on various factors and fluctuates as conditions change (Costa, 2003). To counteract groundwater deficits, satellite data can be used to define groundwater prospect zones and expand artificial recharge initiatives (Eastmond et al., 2008; Hamilton, 2005).
Remote Sensing and Geographic Information System (GIS) techniques have proven useful in managing aquifer reserves. The reliability of these methods depends on the classification standard and average ranks enforced upon the input parameters (Harris et al., 2022). Ancillary data, such as Toposheets and Landsat images, have enabled the creation of thematic maps using a weighted overlay approach to define potential groundwater zones (Kaur et al., 2021).
Chandrapur, located in Maharashtra, India, is known for its abundant mineral resources and strong industrial sector. The district is rich in coal reserves, making it a major Centre for mining activities. Additionally, various industries, such as thermal power plants, cement factories and chemical processing units, have been established in the region. While these activities have contributed to economic growth and employment opportunities, they also raise concerns about their environmental impact, particularly water quality (Kumar et al., 2020).
Mining activities, by their very nature, involve the extraction of minerals from the Earth, often resulting in the disturbance of natural ecosystems and the release of pollutants into the surrounding environment (Li et al., 2020). Similarly, industrial activities such as manufacturing, processing and waste disposal can introduce chemicals and contaminants into nearby water bodies, leading to water pollution and degradation (Galkate et al., 2022; Gibert et al., 2022). As a result, the water quality in Chandrapur district has become a pressing issue that requires thorough investigation, monitoring and mitigation (Liang et al., 2021).
Understanding the impact of mining and industrial activities on water quality is crucial for sustainable development and the preservation of ecosystem health (Meraj et al., 2021). It helps identify the sources and types of contaminants and facilitates the formulation of effective management strategies to mitigate adverse effects and safeguard water resources (Mishra & Bharagava, 2016).
Despite the economic benefits of mining and industrial activities, the potential negative consequences on water quality cannot be ignored. The discharge of pollutants into water bodies can have far-reaching ecological, economic and public health implications (Mpouras et al., 2021). With its extensive mining and industrial operations, Chandrapur faces the challenge of assessing the extent and severity of water contamination caused by these activities (Okogbue & Ukpai, 2013; Singh & Bhakar, 2021; Upadhyay et al., 2019).
Advanced monitoring and assessment techniques are essential to effectively address this problem. Geospatial techniques, including GIS and remote sensing, provide valuable tools for studying the spatial patterns, changes and associations between mining, industrial activities and water quality parameters (Pradhan, 2009). By integrating these techniques, a holistic understanding of the impact on water quality can be achieved, aiding in developing targeted pollution control and management (Prasad et al., 2008; Raju et al., 2019; Rather et al., 2022).
In the Chandrapur study area, elevated chloride and fluoride concentrations in groundwater warrant geochemical investigation. These elements can be critical indicators of potential contamination sources associated with industrial and mining activities (Rodell & Famiglietti, 2002). Elevated chloride levels may be linked to processes like leaching of salts from industrial effluents or the presence of saline aquifers, while increased fluoride concentrations could be attributed to the release of fluoride-bearing minerals during mining operations or industrial discharges. By examining the geochemical signatures of chloride and fluoride in the groundwater, we aim to identify potential contamination sources and provide a deeper understanding of the specific mechanisms driving groundwater quality degradation in this region, further strengthening the foundation of our study and contributing to effective mitigation strategies.
Our study distinguishes itself from existing literature by comprehensively analysing groundwater quality in Chandrapur, India, where mining and industrial activities coexist. While prior research has typically focused on either mining or industrial impacts on water quality separately, our integrated approach allows us to uncover potential synergistic effects, providing a more holistic understanding of the complex dynamics of groundwater contamination in this region. Additionally, applying advanced geospatial techniques, specifically GIS and remote sensing, enhances our analysis’ precision and spatial resolution, enabling a more detailed examination of contaminant distribution. This methodological innovation sets our study apart and contributes to a practical framework for addressing water quality challenges in areas characterised by both mining and industrial activities.
In conclusion, our findings have several implications for sustainable water resource management in regions facing challenges similar to those in Chandrapur. We recommend developing targeted pollution control measures that consider the combined impact of mining and industrial activities on groundwater quality. Additionally, our study underscores the importance of continued monitoring and assessment using geospatial techniques to track changes and implement adaptive management strategies. Finally, the knowledge generated from this research can serve as a valuable resource for policymakers, industry stakeholders and environmentalists, facilitating informed decision-making and contributing to preserving water resources in such critical areas. Future work should focus on expanding the scope of our study to other regions and further refining the integration of geospatial techniques for improved water quality management.
This research utilises GIS and remote sensing techniques to assess the impact of mining and industrial activities on groundwater quality in Chandrapur. GIS integrates, manipulates and analyses geospatial data, while remote sensing captures data across large areas without physical contact, making it an effective method for monitoring environmental changes.
2. METHODOLOGY
2.1. Study area
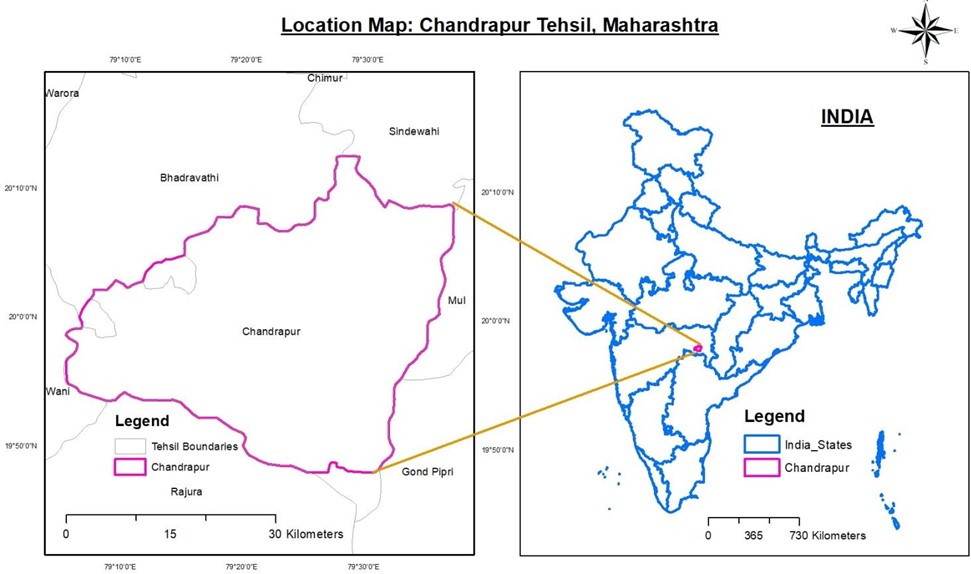
Chandrapur, a city located in Maharashtra in India, is the study area for this research. Geographically positioned between 19.57°N latitude and 79.18°E longitude, Chandrapur boasts a diverse topography marked by plains, hills and rivers (Figure 1). The city is nestled in the Deccan Plateau region, known for its rich mineral resources, particularly coal, and exhibits a tropical monsoon climate, making it suitable for intensive agricultural activities. With an estimated population of over 3.75 million, the district of Chandrapur spreads over approximately 11,443 km2. Agriculture remains a dominant economic activity, sustaining a significant proportion of the rural populace. However, the region has seen a growing focus on industrialisation and mining in recent decades, mainly due to vast coal deposits. The city houses many industrial units, including Chandrapur Super Thermal Power Station, one of India’s largest coal-based power plants, and various coal mines operated by Western Coalfields Limited. These mining and industrial activities have been central to the region’s economic growth but have also raised serious concerns about environmental sustainability and health hazards. Chandrapur’s groundwater is a crucial water supply source for domestic and agricultural purposes. The presence of numerous rivers, such as the Wainganga, Wardha and Irai, plays a significant role in replenishing the groundwater levels. However, the extensive extraction of minerals and relentless discharge of industrial effluents have reportedly led to a steady deterioration of groundwater quality over time. The examination of groundwater quality in Chandrapur, with its intricate blend of agriculture, mining and industrialisation, offers a unique setting to understand the impact of anthropogenic activities on water resources. Consequently, it serves as a valuable study area for this research, with its findings likely to provide crucial insights to manage and mitigate the negative effects of industrial activities on groundwater quality.
2.2. Data used
This study used a multifaceted data set to assess the impact of mining and industrial activities on groundwater quality in Chandrapur, Maharashtra, utilising both spatial and non-spatial data sources. Satellite data from the Linear Imaging Self Scanning Sensor (LISS-3) on the Indian Remote sensing satellite was employed to create land use and land cover (LULC) change maps, with data from 2014 and 2018 allowing us to observe changes over these four years. The district administrative boundary of Chandrapur helped define the study area, ensuring a precise geographical focus for our analysis. Groundwater quality data were sourced from India’s Water Resources Information System (WRIS) and the Central Pollution Control Board (CPCB), yielding extensive hydrological information about the region and insights into groundwater contamination levels. By examining parameters such as pH, electrical conductivity, total dissolved solids and ion concentrations, this study effectively mapped groundwater quality in Chandrapur and assessed the potential impacts of land use changes on this critical water resource. Details of the data set are given in Table 1 and Table 2.
| Sr. No. | Map data | Data source |
|---|---|---|
| 1 | India political boundary shape file | Indian Space Research Organisation (ISRO) |
| 2 | India state boundary shape file | ISRO |
| 3 | India district boundary shape file | ISRO |
| 4 | India tehsil boundary shape file | ISRO |
| 5 | Satellite image – 2014 | LISS-III |
| 6 | Satellite image – 2018 | LISS-III |
| 7 | Satellite Image-2018 (For LULC Map) | Sentinel-II |
| Sr. No. | Statistical data | Data source |
|---|---|---|
| 1 | Ground water quality | INDIA -WRIS |
| 2 | Type of ground water contamination | INDIA – WRIS |
| 3 | Water quality data | CPCB |
Building on the collected data, we meticulously prepared the LULC change maps for 2014 and 2018. This enabled a comprehensive understanding of the transformations in the regional landscape over the four years. In addition to the LULC maps, specific maps highlighting the mining areas and industrial zones for both years were created to represent the extent and alterations in these zones visually. Following this, we focused on understanding the potential impacts of these changes on groundwater quality. We compiled the groundwater quality data from the WRIS and CPCB and developed comprehensive groundwater quality maps for 2014 and 2018. These maps were constructed using the Inverse Distance Weighting (IDW) interpolation method. IDW is a deterministic method for multivariate interpolation with a known scattered set of points. This method was chosen because it assumes that the variable being mapped decreases in influence with distance from its sampled location, providing a precise and visually intuitive means to represent spatially distributed data. By overlaying the LULC, mining and industrial zone maps with the groundwater quality maps for respective years, we could visually analyse the spatial correlation between land use changes, especially the expansion of mining and industrial areas, and the shifts in groundwater quality. Through this approach, the study aims to establish a clearer understanding of how mining and industrial activities may have influenced the groundwater quality in Chandrapur over the analysed period.
2.3. Pre-processing of satellite data
The pre-processing of LISS-3 satellite data from 2014 and 2018 was performed using ERDAS Imagine 2014 software to ensure its accuracy and validity. This multifaceted process began with radiometric correction, which adjusted for sensor irregularities and atmospheric distortions, facilitating accurate surface radiation representation. This was followed by a geometric correction, ensuring the data’s accurate alignment with the Earth’s surface and true geographical positioning. Atmospheric correction was next, accounting for and mitigating atmospheric effects such as scattering and absorption. To further enhance data accuracy, the corrected images were rectified and registered to a common geographical coordinate system, supporting accurate comparison and integration of images from different dates. Finally, image enhancement techniques like contrast stretching and edge enhancement were applied to improve the visual interpretability of satellite images. This comprehensive pre-processing stage, supported by ERDAS Imagine 2014, ensured the data’s reliability and comparability, setting a solid base for the subsequent stages of analysis.
2.4. LULC map
This study utilised processed LISS-3 satellite data to create LULC maps for Chandrapur district in 2014 and 2018. These maps highlighted the changes that occurred in the district’s mining area over a span of four years. The Maximum Likelihood method, an advanced statistical technique, was used in ERDAS Imagine to classify the satellite data. This method assigns each pixel in the image to the highest probability class, providing a more accurate and efficient classification. The data was divided into seven categories: agriculture land, barren or open land, built-up area, forest, other land use, water bodies and mining and industrial Area. The creation of these LULC maps allowed for an accurate visual representation of land use changes, particularly in the mining and industrial areas, providing a robust base for analysing the impacts of these changes on groundwater quality.
| Sr. No. | Ground water contamination in Chandrapur | Level of contamination |
|---|---|---|
| 1 | Salinity (EC above 3000 micro mhos/ cm) (EC: Electrical Conductivity) | 4580 µS/cm |
| 2 | Fluoride (above 1.5 mg/l) | 9.183 mg/l |
| 3 | Nitrate (above 45 mg/l) | 57 mg/l |
| 4 | Arsenic (above 0.01 mg/l) | 0.05 mg/L |
| 5 | Iron (above 1 mg/l) | 3.258 mg/L |
| 6 | Heavy metals: Lead (above 0.01 mg/l), Cadmium (above 0.003 mg/l), Chromium (above 0.05 mg/l) | 0.08 mg/L |
2.5. Ground water quality map
This study delved into an in-depth analysis of groundwater quality in Chandrapur Taluka by identifying the sources and types of pollutants in the region’s water bodies. Field observations were complemented with laboratory data from the India-WRIS web portal to provide a robust data set. Statistical techniques were employed to analyse various physicochemical and microbiological parameters, offering a comprehensive view of water quality. Remote sensing techniques allowed for assessing spatial and temporal variations in water quality, with data from 2014 and 2018 serving as key comparative points. An interpolation model was developed to demonstrate the spread of contaminated areas in groundwater quality, visually representing areas of concern. Finally, the study offered measures to mitigate the impact of contaminant activities on water quality, aiming to provide a roadmap for future conservation efforts in the region. Table 3 shows the ground water contamination in Chandrapur as per the CGWB report.
3. RESULTS AND DISCUSSION
3.1. Water quality assessment
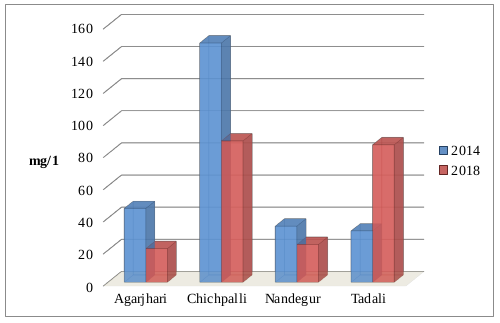
In our water quality evaluation, we employed an interpolation technique to visualise the dispersal of individual contaminants within groundwater, providing a holistic view of regional water quality. We implemented the IDW method to predict the values of each processing cell on the output image based on the surrounding sampled data points. We created two maps for each contaminant to facilitate comparison between the data from 2014 and 2018. The maps were generated using the data provided in the tables appended after the maps. Additionally, to portray the fluctuation in contaminant levels, we prepared bar diagrams from the data.
3.2. Chloride distribution
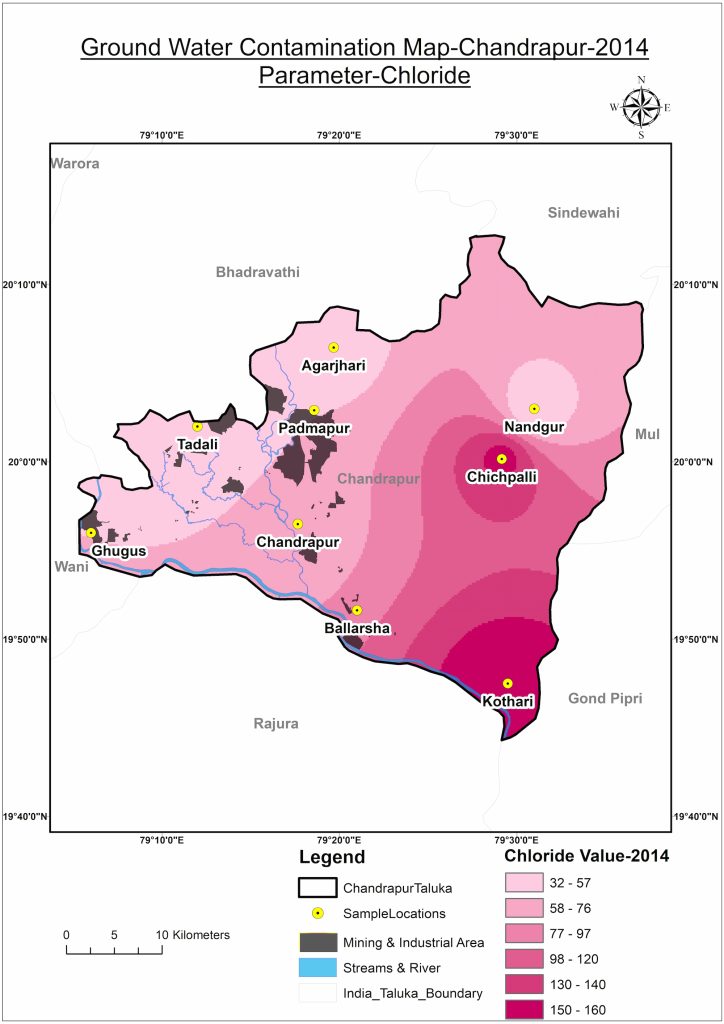
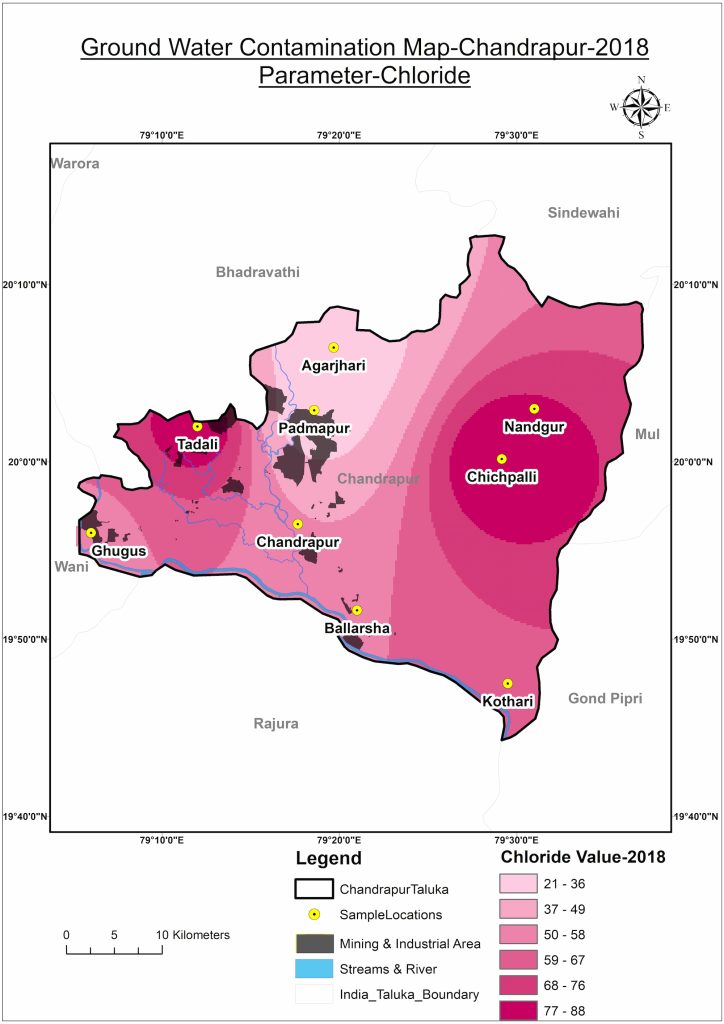
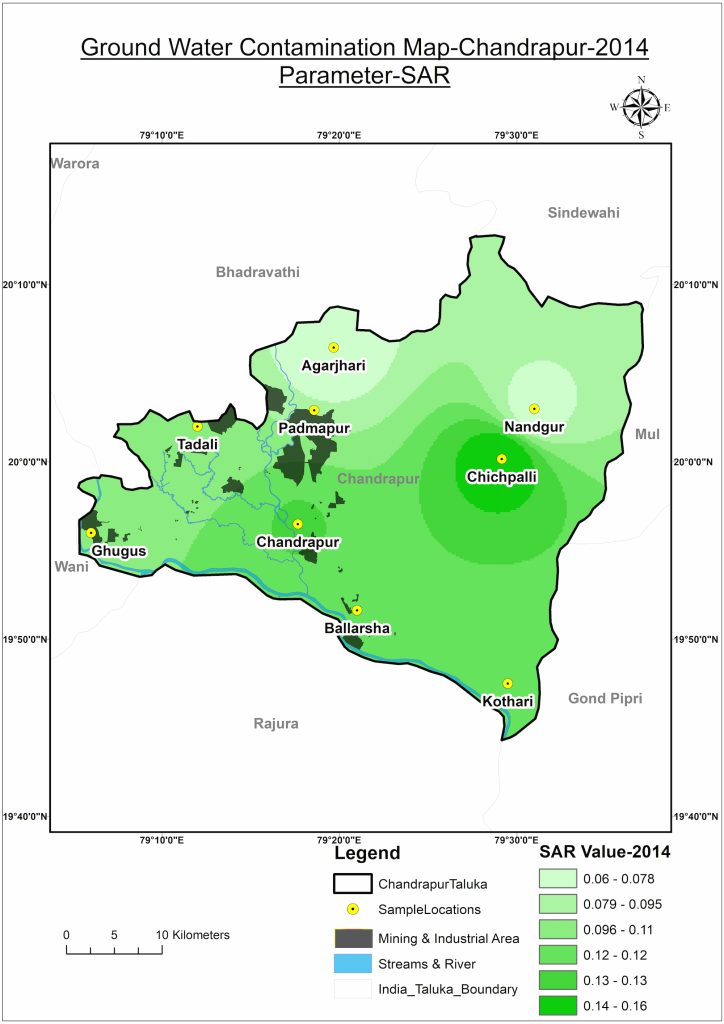
In our assessment of groundwater samples near mining and industrial operations in Chandrapur, the chloride concentration results appeared within the acceptable range, as showcased by the chloride content chart of various sites within Chandrapur. According to the Bureau of Indian Standards (BIS), chloride levels up to 250 mg/L are deemed safe for consumption. The results show that the chloride content within Chandrapur’s water doesn’t pose a significant risk. However, a slight increase in chloride levels can be noted in areas close to mining and industrial activities. The distribution of chloride levels for the years 2014 and 2018 are illustrated in Figure 2 and Figure 3, respectively. Table 4 encapsulates the statistical data representing the chloride distribution for the same years, providing a comparative view of the changes that occurred over this period.
| Sr. No. | Location | 2014 | 2018 |
|---|---|---|---|
| 1 | Agarjhari | 46 | 21.09 |
| 2 | Ballarsha | ND | ND |
| 3 | Chandrapur | 64 | ND |
| 4 | Chichpalli | 149 | 88.09 |
| 5 | Ghugus | ND | 55.83 |
| 6 | Kothari | 163 | ND |
| 7 | Nandegur | 35 | 23.57 |
| 8 | Padmapur | ND | 26.06 |
| 9 | Tadali | 32 | 85.61 |
3.3. Fluoride distribution
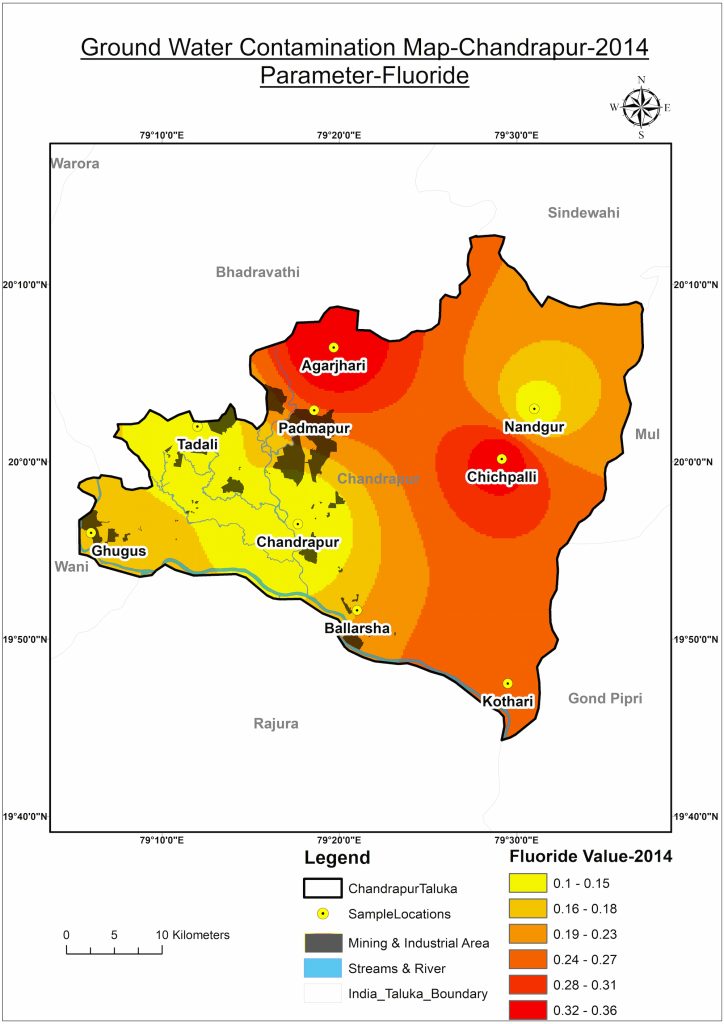
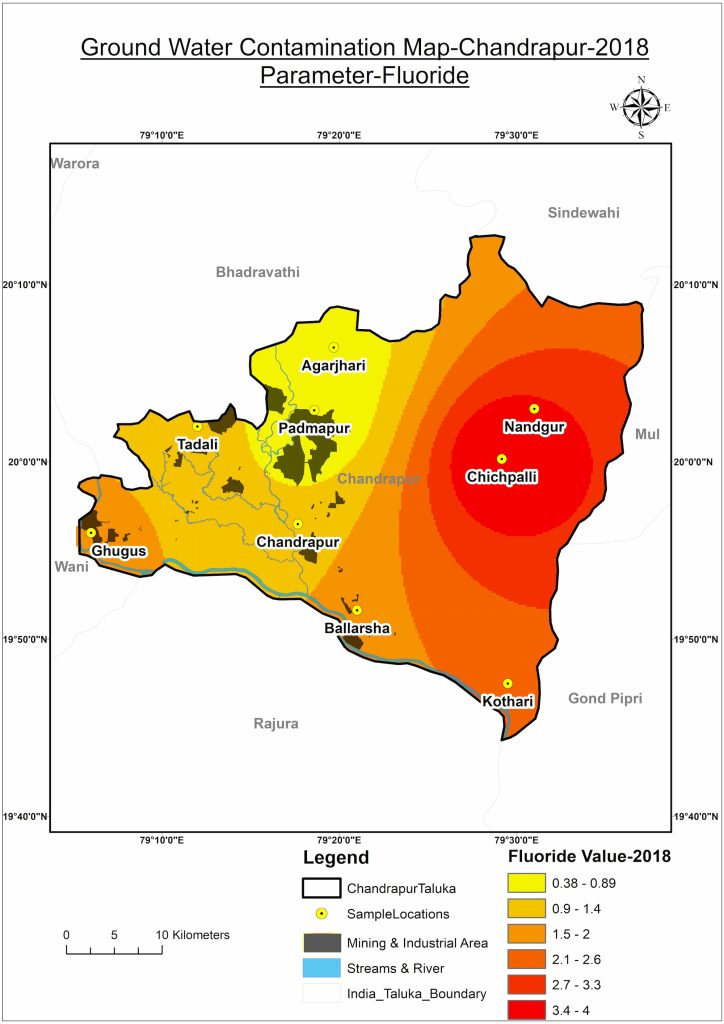
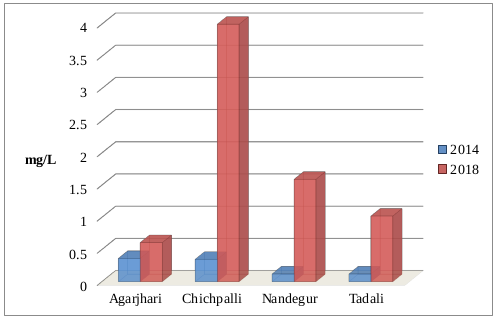
The above ground water contamination map analysis and the data say groundwater samples near Chandrapur mining and industrial areas have elevated fluoride levels. Fluoride contamination is a common issue in areas with industrial activities. Excessive fluoride intake through contaminated water can lead to dental and skeletal fluorosis, posing significant health risks to the local population. As per BIS for water, up to 1.5 ppm of fluoride is suitable for drinking. The above results show fluoride content under the permissible limits, but a rise can be seen in areas near mining and industrial activities in the year 2018 compared to year 2014, which is alarming. Table 5 shows Fluoride distribution in study area.
| Sr. No. | Location | 2014 | 2018 |
|---|---|---|---|
| 1 | Agarjhari | 0.36 | 0.61 |
| 2 | Ballarsha | ND | ND |
| 3 | Chandrapur | 0.1 | ND |
| 4 | Chichpalli | 0.35 | 4 |
| 5 | Ghugus | ND | 1.58 |
| 6 | Kothari | 0.27 | ND |
| 7 | Nandegur | 0.12 | 1.59 |
| 8 | Padmapur | ND | 0.38 |
| 9 | Tadali | 0.12 | 1.02 |
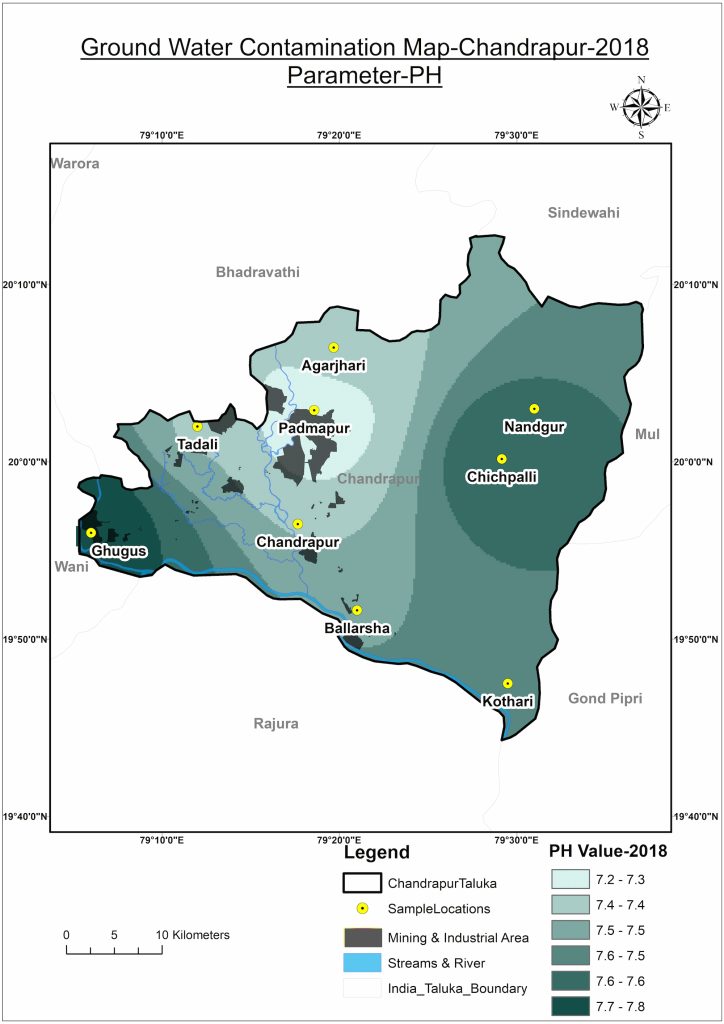
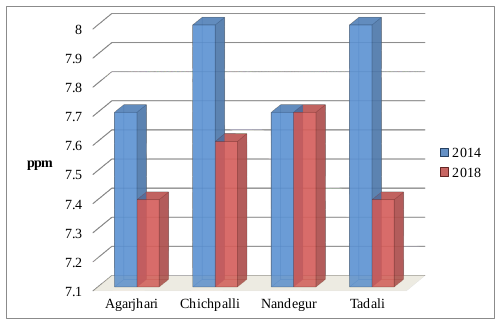
3.4. pH distribution
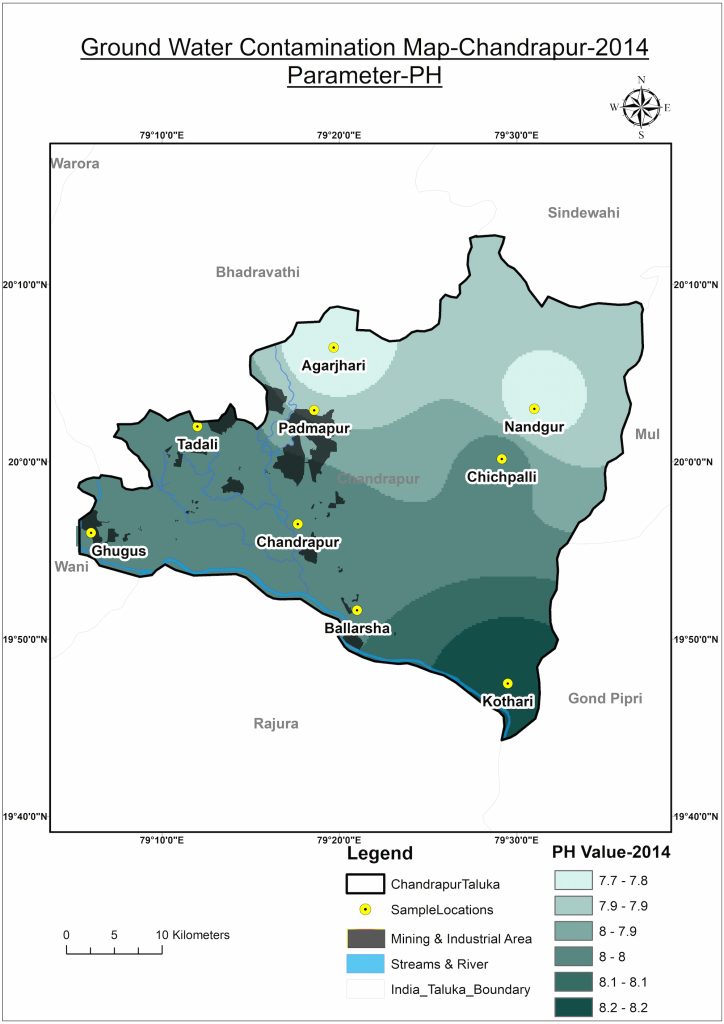
The analysis of groundwater pH near mining and industrial areas indicated variations. Mining activities often contribute to acidic mine drainage, while industrial processes can introduce alkaline substances into the water. Such pH variations can adversely affect aquatic ecosystems and the overall water quality. The good quality of water is 6.5pH; less or higher value indicates non-drinkable or poor quality as per BIS [33, 34]. After evaluating the maps and data above, the pH value is under the permitted limits, but some decrease in value can be seen from year 2014 to year 2018 (Table 6).
| Sr. No. | Location | 2014 | 2018 |
|---|---|---|---|
| 1 | Agarjhari | 7.7 | 7.4 |
| 2 | Ballarsha | ND | ND |
| 3 | Chandrapur | 8 | ND |
| 4 | Chichpalli | 8 | 7.6 |
| 5 | Ghugus | ND | 7.8 |
| 6 | Kothari | 8.2 | ND |
| 7 | Nandegur | 7.7 | 7.7 |
| 8 | Padmapur | ND | 7.2 |
| 9 | Tadali | 8 | 7.4 |
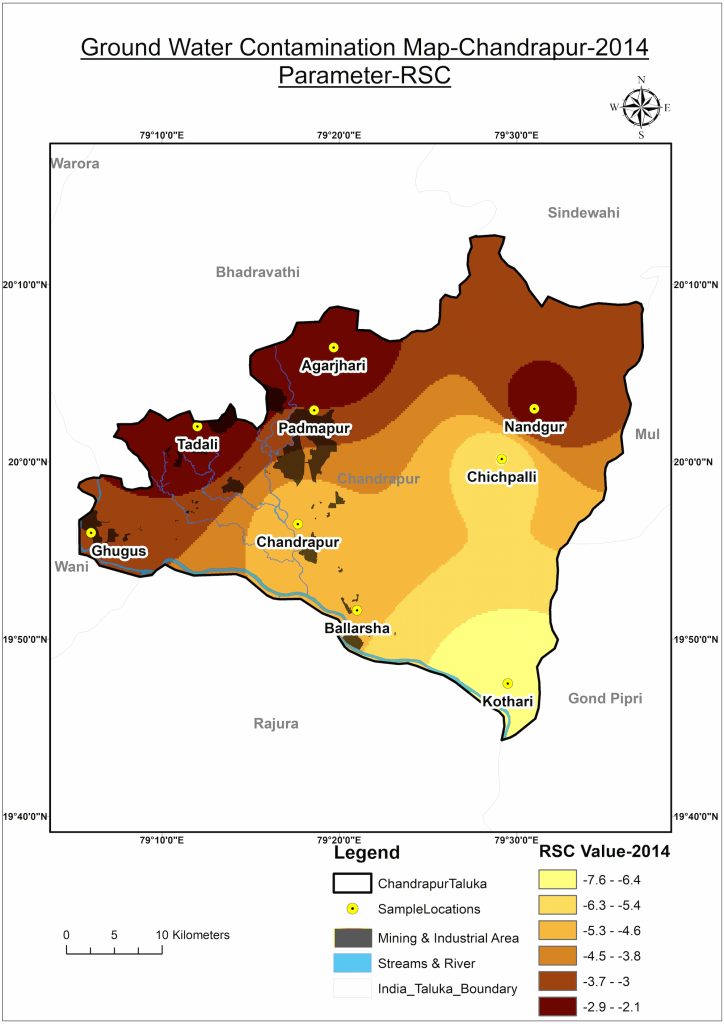
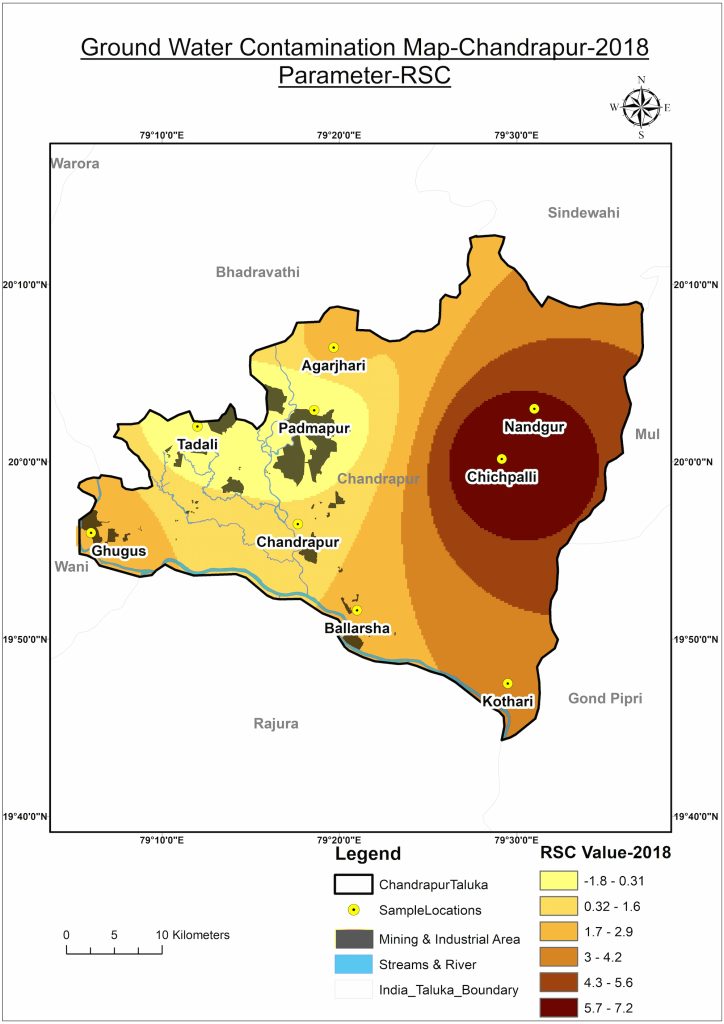
3.5. RSC distribution
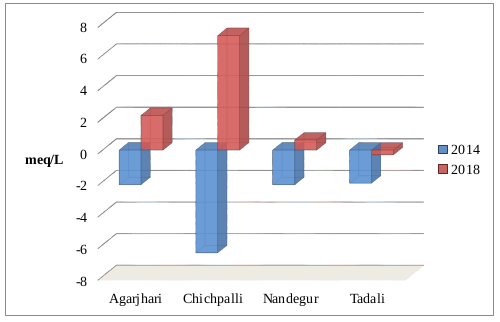
RSC indicates the potential for sodium hazard in water. Groundwater samples near mining and industrial activities in Chandrapur exhibited higher RSC values in 2018 compared to 2014. Elevated RSC levels indicate a higher concentration of sodium carbonate and bicarbonate, which can lead to soil degradation and reduced water availability for agricultural purposes. The presence of RSC highlights the impact of mining and industrial activities on water quality and the subsequent consequences on local agriculture. BIS suggests that an RSC level of 1.25 and lower is safe for irrigation (Table 7).
| Sr. No. | Location | 2014 | 2018 |
|---|---|---|---|
| 1 | Agarjhari | −2.2 | 2.19 |
| 2 | Ballarsha | ND | ND |
| 3 | Chandrapur | −5.1 | ND |
| 4 | Chichpalli | −6.5 | 7.24 |
| 5 | Ghugus | ND | 2.61 |
| 6 | Kothari | −7.6 | ND |
| 7 | Nandegur | −2.2 | 0.63 |
| 8 | Padmapur | ND | −1.78 |
| 9 | Tadali | −2.1 | −0.30 |
3.6. SAR distribution
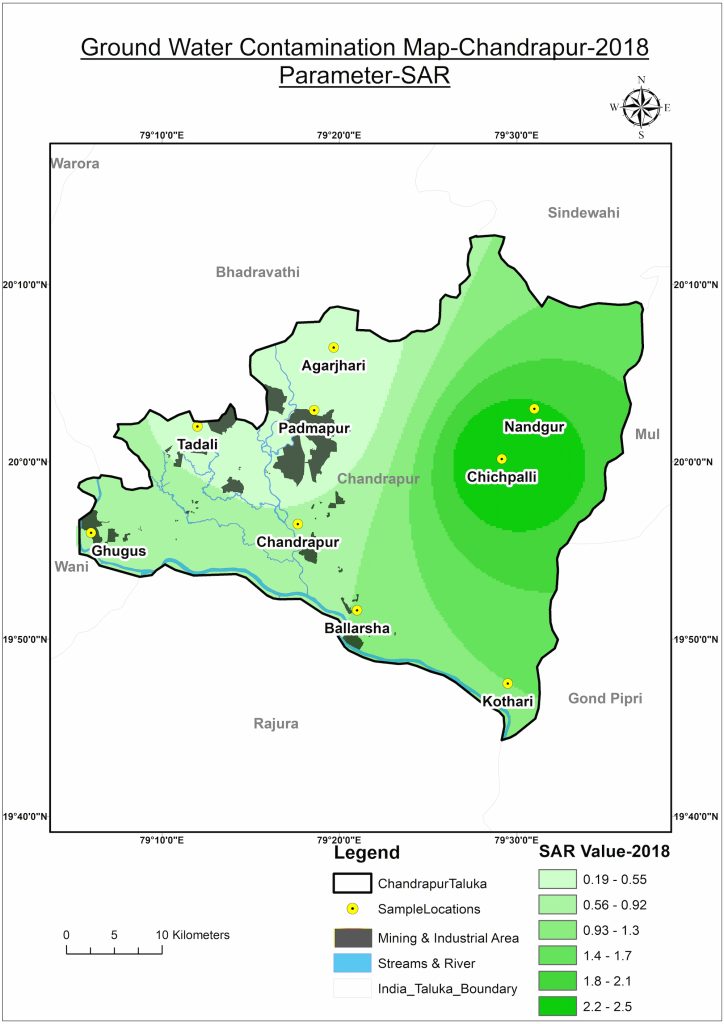
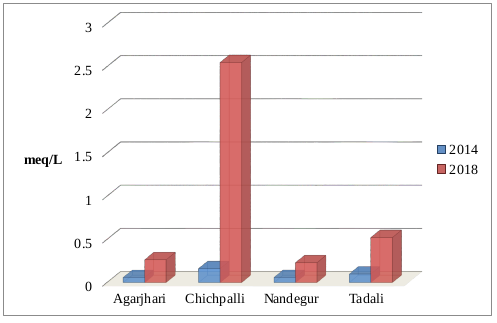
SAR is another important parameter used to assess water quality for irrigation purposes [35]. Groundwater samples near mining and industrial areas in Chandrapur demonstrated higher SAR values in 2018 compared to 2014. Elevated SAR values indicate a higher concentration of sodium ions than other essential cautions, such as calcium and magnesium. High SAR levels can lead to soil degradation, reduced fertility and impaired crop growth, further affecting agricultural productivity in the region. As per the standards of BIS, the SAR value below three is considered good for irrigation purposes, and despite a rise in Chandrapur, it still seems to be under control (Table 8).
| Sr. No. | Location | 2014 | 2018 |
|---|---|---|---|
| 1 | Agarjhari | 0.06 | 0.26 |
| 2 | Ballarsha | ND | ND |
| 3 | Chandrapur | 0.12 | ND |
| 4 | Chichpalli | 0.16 | 2.55 |
| 5 | Ghugus | ND | 0.81 |
| 6 | Kothari | 0.11 | ND |
| 7 | Nandegur | 0.06 | 0.23 |
| 8 | Padmapur | ND | 0.19 |
| 9 | Tadali | 0.1 | 0.52 |
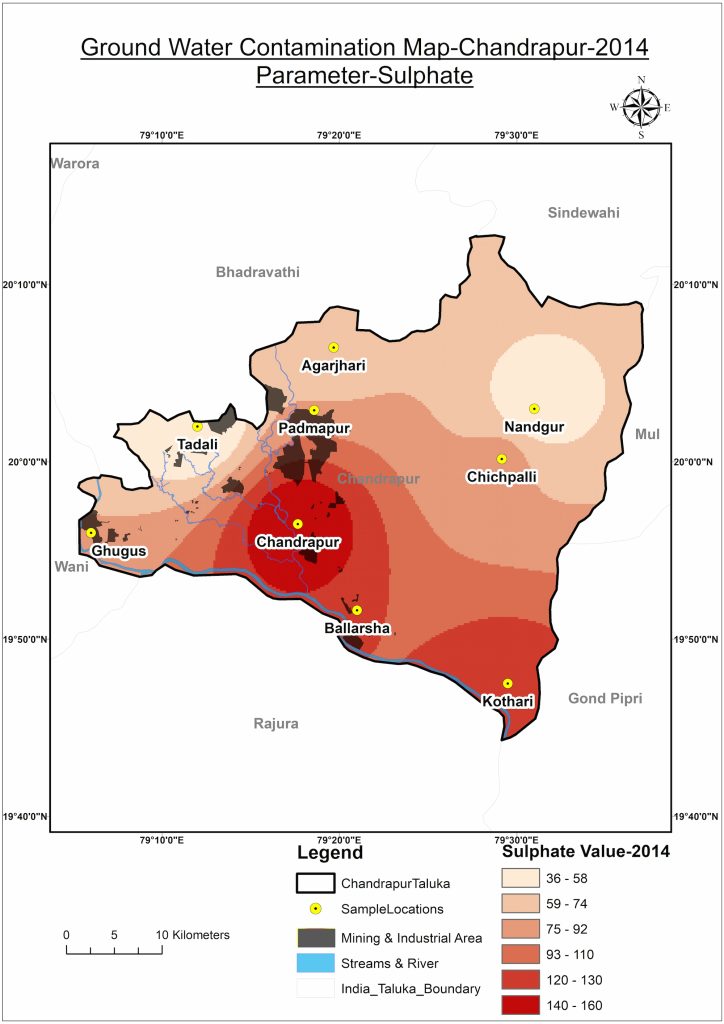
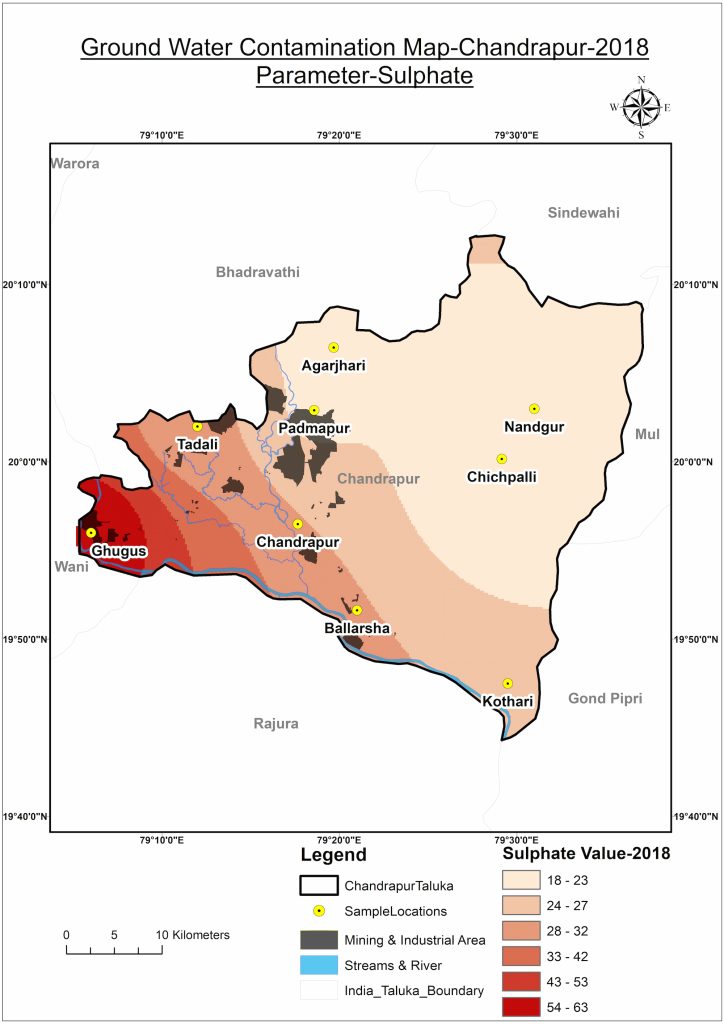
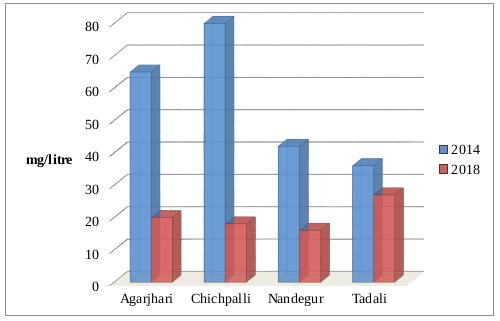
3.7. Sulphate distribution
Sulphate contamination can occur due to various industrial activities, including mining, smelting and chemical manufacturing. Excessive sulphate levels in water can lead to aesthetic issues such as a bitter taste and potential health effects in high concentrations. By analysing the data above, the sulphate value in the study area of Chandrapur in 2018 is reduced compared to data from 2014. The BIS limit for water’s Sulphate content ranges from 200 mg/L to 400 mg/L (Table 9).
| Sr. No. | Location | 2014 | 2018 |
|---|---|---|---|
| 1 | Agarjhari | 65 | 20 |
| 2 | Ballarsha | ND | ND |
| 3 | Chandrapur | 158 | ND |
| 4 | Chichpalli | 80 | 18 |
| 5 | Ghugus | ND | 63 |
| 6 | Kothari | 124 | ND |
| 7 | Nandegur | 42 | 16 |
| 8 | Padmapur | ND | 22 |
| 9 | Tadali | 36 | 27 |
4. DISCUSSION
Various statistical values provide a deeper insight into the trends observed over the years in assessing groundwater quality in Chandrapur. The data reveals that chloride levels, while primarily within the permissible range set by the BIS of up to 250 mg/L, exhibited a slight increase in areas proximate to industrial activities from 2014 to 2018. This increase in chloride content may seem subtle, but it underscores the potential impact of industrial processes on local water quality and emphasises the importance of ongoing monitoring to prevent future breaches of the acceptable limits (Vereecken et al., 2022; Wang et al., 2022; Zhang et al., 2021).
Similarly, fluoride contamination levels increased from 2014 to 2018 in areas near mining and industrial sites, although they remained below the BIS permissible limit of 1.5 ppm. This finding is of significant concern as excessive fluoride intake can lead to health risks. Although within acceptable limits, the fluctuations in pH values also suggest potential changes in water quality (Vincent, 2004; Wolf et al., 2007). Furthermore, higher RSC and SAR values near industrial areas in 2018 compared to 2014 indicate the need for vigilance in preventing soil degradation and maintaining agricultural productivity (Meraj, 2021; Shyam et al., 2022). On a positive note, the declining trend in sulphate levels in the region suggests potential improvements in water quality (Zink et al., 2010). These statistical insights collectively emphasise the need for sustained monitoring, remediation efforts and policy interventions to preserve Chandrapur’s water quality, public health and the environment.
5. CONCLUSION
The comprehensive assessment of groundwater quality in Chandrapur using the IDW method revealed notable trends and fluctuations in various contaminant levels over the years 2014 to 2018. While chloride concentrations remained within acceptable limits set by the BIS, a subtle increase near industrial activities underscores the potential impact of such operations on local water quality. Elevated fluoride levels in proximity to mining and industrial sites, albeit below the permissible limit, raise concerns due to associated health risks. Variations in pH values and higher RSC and SAR levels near industrial areas semphasise the importance of ongoing monitoring to prevent soil degradation and maintain agricultural productivity. On a positive note, the decreasing trend in sulphate levels suggests potential improvements in water quality. These findings collectively underscore the need for sustained monitoring, remediation efforts and policy interventions to safeguard Chandrapur’s water quality, public health and the environment, considering the potential long-term consequences of industrial and mining activities on the region’s water resources.
6. ACKNOWLEDGEMENT
This work is supported by the Asia-Pacific Network for Global Change Research (APN) under the Collaborative Regional Research Programme (CRRP) project with project reference number CRRP2019-01MY-Kumar.
APPENDIX